An introductory text in Communication Theory would tell you that antennas radiate uniformly in all directions and the power received at a given distance ‘d’ is proportional to 1/(d)^2. Such an antenna is called an isotropic radiator. However, real world antennas are not isotropic radiators. They transmit energy in only those directions where it is needed. The Gain of a antenna is defined as the ratio of the power transmitted (or received) in a given direction to the power transmitted in that direction by an isotropic source and is expressed in dBi.
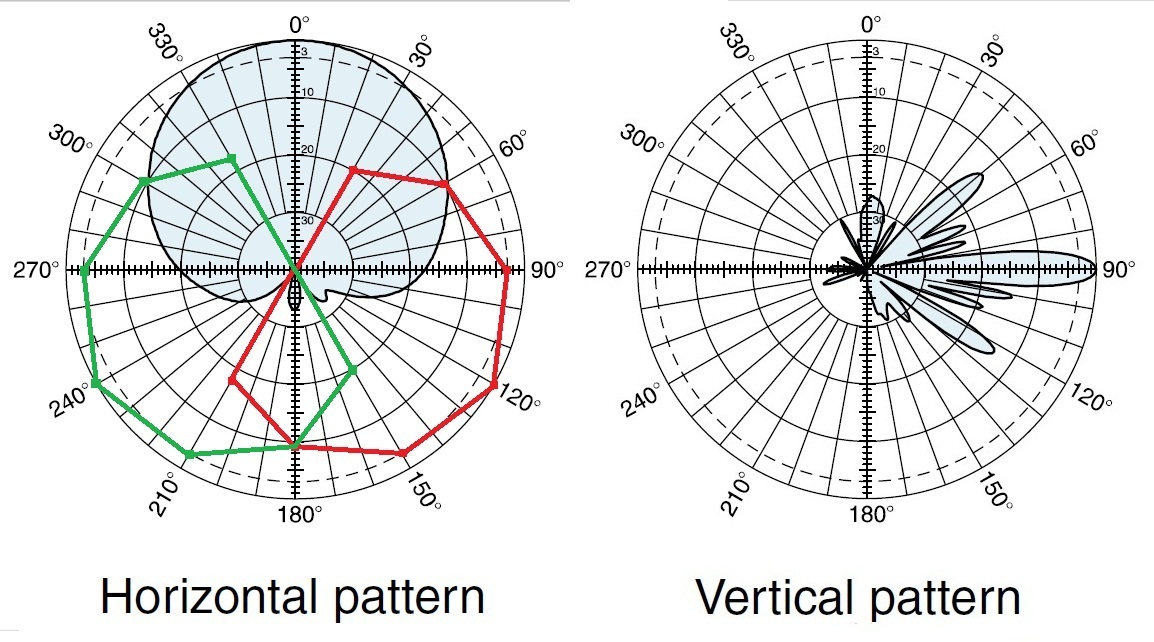
Although antenna Gain is a three dimensional quantity, the Gain is usually given along horizontal and vertical planes passing through the center of the antenna. The Horizontal and Vertical Gain patterns for a popular base station antenna Kathrein 742215 are shown in the figure below.
The actual Gain is given with respect to the maximum Gain which is a function of the frequency e.g. in the 1710-1880 MHz band the maximum Gain has a value of 17.7dBi. Another important parameter is the Half Power Beam Width (HPBW) which has values of 68 degree and 7.1 degree in the horizontal and vertical planes respectively. HPBW is defined as the angle in degrees within which the power level is equal to or above the -3 dB level of the maximum.
Also shown in the above figure are approximate Horizontal Gain patterns for two antennas that have been rotated at 120 degrees and 240 degrees. Together these three antennas cover the region defined as a cell. There would obviously be lesser coverage in areas around the intersection of two beams.
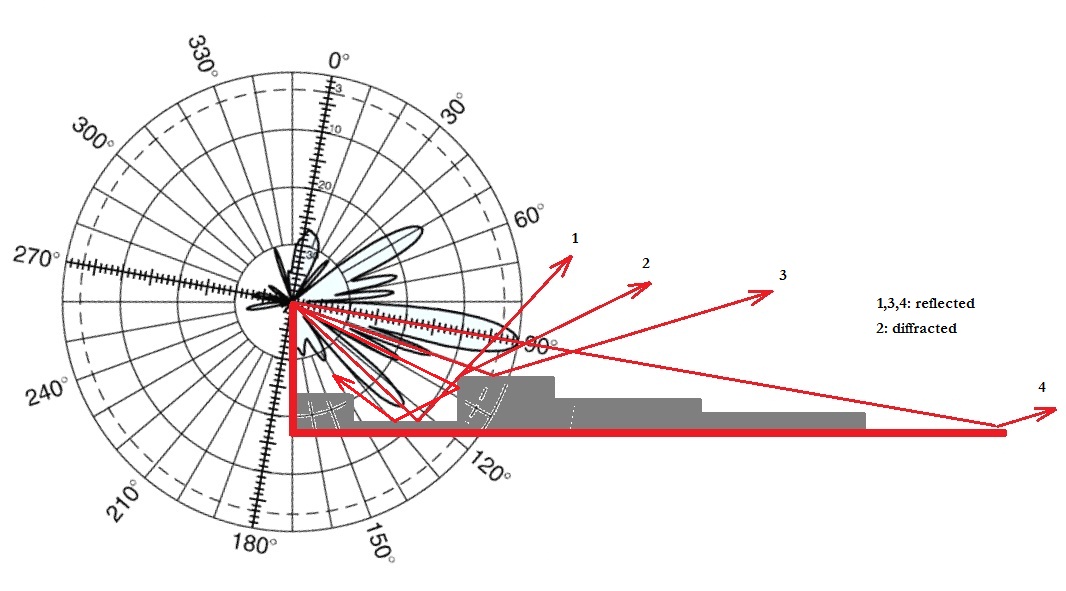
A somewhat more interesting pattern is in the vertical direction where the HPBW is only 7.1 degrees. Thus it is very important to direct this beam in the right direction. A perfectly horizontal beam would result in a large cell radius but may also result in weak signal areas around the base station. A solution to this problem is to give a small tilt to the antenna in the downward direction, usually 5-10 degrees. This would reduce the cell radius but allow for a more uniform distribution of energy within the cell. In reality the signal from the main beam and side lobes (one significant side lobe around -15 dB) would bounce off the ground and buildings around the cell site and spread the signal around the cell.
The above figure gives a 2D view of signal propagation from an elevated antenna with a downward tilt of 10 degrees in an urban environment.
Author: Yasir Ahmed (aka John)
More than 20 years of experience in various organizations in Pakistan, the USA, and Europe. Worked as a Research Assistant within the Mobile and Portable Radio Group (MPRG) of Virginia Tech and was one of the first researchers to propose Space Time Block Codes for eight transmit antennas. The collaboration with MPRG continued even after graduating with an MSEE degree and has resulted in 12 research publications and a book on Wireless Communications. Worked for Qualcomm USA as an Engineer with the key role of performance and conformance testing of UMTS modems. Qualcomm is the inventor of CDMA technology and owns patents critical to the 4G and 5G standards.


Can you convert dB to meters on vertical pattern? I will draw that on real object. Thanks
dB is the log of ratio of two quantities e.g. transmit power to receive power
Path loss in dB = 10*log10(Pt/Pr)
Please I would like to know how to draw a 2D view of signal propagation from an elevated antenna with a downward tilt in matlab.
good job !